
SMEconomics Overview
-
Australia’s economy is now bigger than it was prior to the pandemic with GDP, investment, consumer spending and employment all above pre-COVID levels. Unemployment is also lower than prior to the onset of COVID-19, falling to 5.1% in May.
-
The global economy is also recovering strongly with the world’s two biggest economies, the USA and China, leading the way. With the US vaccination rate hitting 50% in the middle of 2021 and government policy stimulus providing a boost, the economy should perform well for several years.
-
The COVID-19 pandemic is far from over despite tremendous progress on vaccines. Mutations have produced increasingly contagious variants, with the latest Delta variant becoming a real issue in many countries. The more contagious the variant, the harder it is to contain and the higher the vaccination rate must be to bring the virus under control.
-
Australia has seen two significant outbreaks of the Delta variant at the start of winter. These have lead to large scale lockdowns in Victoria and more recently NSW and the Northern Territory, with localised lockdowns and border closures in other states. Victoria appears to have contained the outbreak with a two week lockdown and is easing restrictions.
-
A continued expansion of economic activity in Australia is reliant on successfully containing outbreaks of the Delta variant with limited lockdowns. Until Australia’s vaccination rate is well above 60% we cannot transition from the current elimination strategy to begin living with COVID-19. This is unlikely to happen in 2021.
-
The economy is being buoyed by the largest economic policy stimulus program in Australia’s history. Not only is fiscal policy highly expansionary but monetary policy is accommodative and even State governments are providing new and interesting incentives for consumers to spend and businesses to invest.
-
The recovery is not evenly spread, with some industries and geographic areas still struggling. In terms of the overall economic numbers these soft spots are being overwhelmed by booming conditions in other sectors, notably housing, health care, construction and retail trade.
-
The challenge for Australian businesses is how to manage through a booming economy. Not only are cost pressures mounting in certain parts of the supply chain, but the economy is rapidly running out of workers.
-
With the international border closed to migration, the most important source of new workers for Australian business has been shut off. New strains of the coronavirus and a lack of political will means that it is expected that the international border will be closed until at least the middle of 2022, if not longer.
-
The economic recovery could run out of steam if new workers cannot be sourced. The Federal government has put in place incentives to increase workforce participation through programs like the childcare subsidy, as well as increased funding for reskilling and upskilling. Whether or not these programs can be effective at increasing the supply of workers remains to be seen. Australia already has one of the highest participation rates in the world.
-
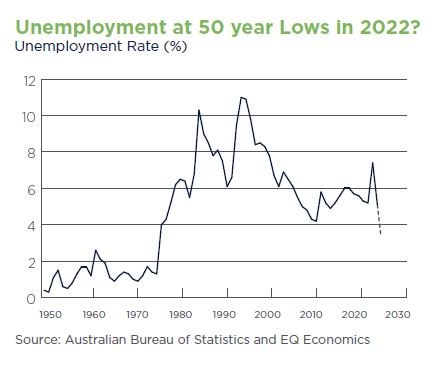
The workforce numbers in Australia highlight the challenge. Labour demand indicators suggest that the economy needs between 25,000 and 30,000 new workers each month. With the borders closed the pool of available workers, the labour force, is only growing by around 8,000 people a month. Unless the demand for workers drops, or the supply increases, Australia’s unemployment rate is expected to fall below 4% in 2022, the lowest in over 50 years.
-
The competition for workers across the economy is set to increase dramatically, something we have not seen in Australia for over a decade. When the demand for labour consistently exceeds supply, wages will respond. Thus far we are only seeing isolated examples of outsized wage increases, but business should be expecting to pay more to not only attract new staff but also to retain workers.
-
The key for business will be the ability to pass on higher costs to their customers. For some businesses this will involve a simple conversation with key clients, but for many it is a much riskier and complex task. Working out how to protect margins through higher pricing will be a critical success factor for many businesses in 2022.
-
Adding to the challenging operating environment is the prospect of higher interest rates. Fixed rates from three to five years term are already moving higher in anticipation of a higher RBA cash rate at some stage in the next two years. Although the RBA has been telling us that the cash rate will remain at 0.10% until 2024, that view is looking increasingly untenable. We should be factoring in a small increase in short-term interest rates from late 2022 and through 2023.
-
When the time comes to increase interest rates, the rise will be modest by historical standards. Even in the face of a strong economy and rising inflation, the RBA will only need to raise interest rates by between 1.5% and 2% to address inflation risks.
-
The Australian dollar has performed poorly against most major currencies despite high iron ore prices and a strong domestic economy. The currency appears to be stuck in a US70c to US80c range for the medium term.
-
House prices continue to rise strongly in the middle of 2021 with a strong labour market and low interest rates providing momentum to first homebuyers and investors. House prices should be expected to continue to rise through to the end of 2021, but new supply and higher interest rates in 2022 could slow the gains.
Australian household finances are in great shape
Strong household finances ultimately mean that consumers can spend and invest. Despite the fears of the worst economic downturn since the Great Depression, Australia’s overall household sector balance sheet is in great shape.
Income is the foundation of good household finances. This primarily means having a job. Ensuring that wages are keeping pace with the cost of living is also important, as is access to savings. When the pandemic struck, a primary objective of economic policy response was to shore up household finances. This was the main aim of the JobKeeper program - to keep people in jobs and maintain a reasonable level of income.
Through the height of the pandemic last year total household income hit a record high level of $349bn in a single quarter. Household income, which had been growing at around 3% a year over the previous five years, spiked in the middle of 2020 (see chart), largely the result of a temporary boost to social security payments.
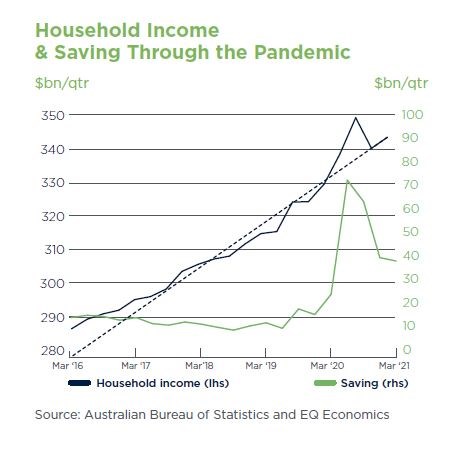
Households built up a substantial financial buffer in the form of higher savings through the pandemic. Over the three years to 2019 (pre-COVID) total household saving averaged $13.1bn each quarter. Through the pandemic saving lifted substantially, averaging $44.7bn per quarter over the year to March 2021, a $223bn accumulation, $158bn of which was above normal saving behaviour.
This is a large financial buffer sitting within the household sector that will support consumption even if incomes take a turn for the worst.
Household sector net wealth increased by $790bn in 2020 to stand at $12trn. This was the result of a $843bn increase in assets and a $54bn increase in financial liabilities, mainly mortgages. Highly liquid deposits made a bigger than usual contribution to the increase in household wealth rising by $140bn to a total of 1.3trn. At the end of 2020 total household sector assets in Australia stood at $14.6trn made up of $8.5trn in dwellings and land, $3.3trn of superannuation and a further $2.4trn of financial assets including deposits.
Household sector net assets are almost six times the annual output of the entire economy and more than 20 times annual household income. What is most reassuring is that the $2.6trn of household liabilities, $2.4trn of which is mortgage debt, is only 18% of total assets.
Unsurprisingly, confidence is at a high level. The Westpac-Melbourne Institute measure reached one of its highest readings ever in April. Solid income growth, a strong financial position and high confidence all point to a robust consumer markets over the period ahead.
The high level of deposits also suggests that consumers will increasingly look for better returns on their investment, a good portion of which is likely to find its way into investment property.
Is Australia running out of workers?
Closed borders means that a major part of the supply of new workers to the Australian economy is not available. About half of the workers that fill jobs in Australia each year come from overseas, be they temporary visa holders such as backpackers and university students, or permanent arrivals.
The government has closed the border to overseas arrivals, halting this inflow of workers into the economy. Last year that did not seem to be a problem as unemployment increased. As the economy recovers and the demand for new staff surges to historically high levels, this is set to become a real problem for the economy and a potential headache for employers.
The employment data for May showed a 115,000 increase in employment and a spectacular 0.4 percentage point drop in the unemployment rate to 5.1%. Employment is now higher than prior to the pandemic, unemployment is lower and underemployment has dropped to the lowest level since 2013.
Fears of a post-JobKeeper cliff for employment have quickly been replaced with a concern that we do not have enough workers within our borders to satisfy demand.
With borders closed, the supply of foreign workers has all but dried up. This is borne out in the labour force data. Over the four years to the end of 2019 the average monthly increase in the Australia workforce has been 21,000. Since the pandemic struck and the border closed, workforce growth has averaged just 8,000 a month.
The impact of the closed border has been complex. Not only have new arrivals ground to a halt, many temporary visa holders have had to leave the country. We have also seen a big lift in the number of Australian’s returning home from overseas and a fall in the number of Australians leaving to work overseas.
There is also a geographic component to these complex flows of people within our economy. Historically the States of NSW and Victoria have seen the largest inflow of immigrants, mostly into Sydney and Melbourne. These two States have also seen the biggest outflows of people to other States. With the border closed this pattern has remained in place, albeit with few international migrant inflows. Victoria’s population growth ground to a halt in 2020 with a natural population increase of 32,000 offset by interstate and international outflows of 30,000.
The supply of workers is constrained but the demand for labour is higher than ever. Labour demand indicators are consistent with a requirement of around 30,000 new workers a month across the economy. With the border closed Australia is relying on lower unemployment and increasing workforce participation to fill those jobs.
If the participation rate remains unchanged at the current historically high level of 66.2% and employment grows at 30,000 a month, the unemployment rate would be expected to fall below 3% by the middle of next year. Even if we get participation up by 0.5% to 66.7%, the unemployment rate would still fall below 4% in June 2022.
The government is hoping that policies to support participation and the reskilling of the workforce will ease pressures on the labour market. The market mechanism to deal with excess demand is rationing through higher prices, that is, higher wages. The worst of all worlds is if we have jobs that go unfilled, and employers have to pay more for staff through higher wages.
Industry Focus #1
Hospitality: Navigating the pandemic
The hospitality industry has been at the economic coalface of the COVID 19 pandemic. Heavily impacted by lockdowns and various restrictions on social gatherings, the hospitality industry has had to manage numerous operating challenges as well as persistent uncertainty over the last 15 months.
From a financial perspective, the industry has performed well. Despite a near 20% drop in sales revenues in 2020, industry wide profits jumped 50%. Cashflow support measures and the JobKeeper program have been central to these strong financial outcomes.
The hospitality sector is broken up into three broad sub sectors: accommodation, restaurants and cafés, and catering services. Restaurants and cafés have led the recovery from the initial nationwide lockdowns in 2020. Retail sales at restaurants and cafés in most States are either back to or above pre-COVID levels as at April 2021.
Catering services, which covers everything from healthcare to business events, have lagged the recovery but are within 20% of pre-COVID levels. As at March 2021, accommodation services remain in the doldrums at almost 75% below normal, although anecdotal evidence suggests a strong recovery in the accommodation market has occurred since the Easter holidays.
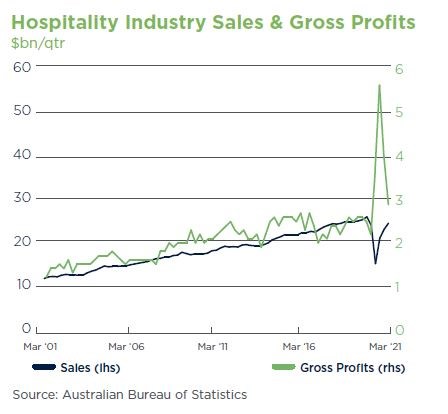
Industry wide sales collapsed in 2020, falling from $102bn in 2019 to $83bn in 2020. Despite the fall in sales, gross profits have soared, rising from $9.8bn in 2019 to $15.2bn in 2020 (see chart). Gross profits have been stable at around 10% of sales for the past 20 years.
The COVID spike in profits temporarily pushed that ratio up to 25%. Over the year to March 2021 the industry has received a $5bn financial windfall, that is, a jump in profits over and above the historical norm.
Businesses have responded to these favourable financial circumstances by increasing employment and investing in new plant and equipment, helping to directly support household incomes and support other businesses across the economy.
Industry employment over the year to February 2021 declined by 9.2%, a smaller decline than overall sales. Indeed, businesses have been quick to hire. The hospitality workforce rose by 208,000 between May 2020 and February 2021, an increase of 32%. Total industry employment stands at 851,000 in February, one of the biggest employing industry’s in the economy, and is on track to see further growth during the course of 2021.
Prior to the pandemic the hospitality industry would spend just under $2bn a year on new plant and equipment. Investment fell 50% through the middle of 2020 but has since bounced back strongly. Over the six months to March 2021, new capital expenditure on plant and equipment rose to $1bn, with the first three months of 2021 one of the strongest quarters on record.
Despite the ongoing fight against COVID-19 and all the uncertainties that this brings to the hospitality industry, businesses are hiring and investing, in no small part due to the strong cashflow boost that emergency policy programs have provided.
Industry Focus #2
Restaurants and Cafés: Onwards and upwards
This article focuses on restaurants and cafés and the challenges that these businesses will be confronted with as we continue to fight the COVID-19 pandemic and establish a strong recovery in the broader economy.
The post-JobKeeper operating environment presents many challenges. The two most prominent are:
- Access to staff and rising cost pressures
- Operational disruption from periodic outbreaks and government restrictions on social gathering
Australia’s international border is expected to remain closed for at least another 9 months, and when it opens it will be gradual. The closed border presents two challenges for restaurants and cafés: a big reduction of international visitors, and no immigration (an important source of staff). The cessation of international tourism impacts some businesses more than others, with strong domestic tourism providing an offset to the overall industry.
Sourcing staff is much more problematic for the industry. Many roles, from low skilled kitchen hands to top chefs and wait staff, are filled by immigrants, be they temporary or permanent arrivals.
Café and restaurant sales have made a strong comeback in 2021 in most states. Periodic restrictions on social gatherings and even short snap lockdowns have not interrupted the underlying recovery. Domestic tourism has flourished since the Easter break, buoyed by the vaccine rollout and a more restrained approach to state border closures.
Industry feedback and retail sales data indicates that short-term restrictions and even snap lockdowns can be managed by the industry, but longer lockdowns do tremendous damage to sales, and in a post-JobKeeper world, this could threaten the viability of small hospitality operators.
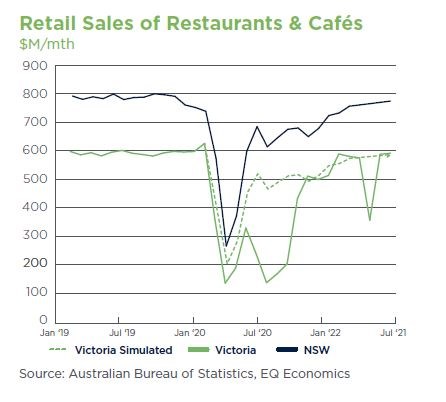
A comparison of sales data from NSW and Victoria over the 2020/21 financial year highlight how important the government’s approach to managing outbreaks of COVID-19 are to restaurants and cafés (see chart).
The NSW government’s approach to outbreaks of COVID-19 involves highly targeted but limited restrictions restrictions with the aim of no city or statewide lockdowns. This approach has allowed restaurants and cafés to grow sales in 2020/21 despite several outbreaks. In NSW restaurant and café sales rose from $7.9bn in 2019/20 to $8.2bn in 2020/21.
In contrast, restaurant and café sales in Victoria fell from $5.8bn in 2019/20 to $4.8bn in 2020/21, heavily impacted by long lockdown periods including the most recent one in June of this year. Simulating sales in Victoria over the 2020/21 financial year using the profile from NSW is displayed in the chart.
If Victorian restaurants and cafés had experienced a similar operating environment to those in NSW, this simple analysis suggests that sales would have been $1.5bn (31%) higher. Qld, SA and WA, which have all had outbreaks but have managed these with short lockdowns and other temporary restrictions, have seen their restaurants and café sales also grow this year, in line with NSW.
With new strains of COVID-19 pointing to an extended fight against the virus, the restaurant and café sector will be confronted by these operational challenges for the foreseeable future. With the end of JobKeeper, government policy must now focus on alleviating these strains on the industry. Looking at how to source foreign workers will be very helpful to many operators, and avoiding harsh state-wide lockdowns that extend for more than a few days is also important.
Construction activity is on the rise
An upswing in the building construction cycle is now underway in Australia. Buildings are defined as residential and commercial structures, but excludes infrastructure.
There has been a reliable building construction cycle in Australia over the last 30 years with each cycle lasting about 10 years (see chart). A range of factors influence the construction cycle including underlying economic activity, business confidence, funding costs and the availability of credit. Ultimately, new building activity comes about because:
-
An expanding economy, driven by a larger population, needs more residential and commercial structures.
-
A changing economy needs new types of buildings. The way people live, new technology and industrial change all create demand for new buildings.
-
Buildings have to be replaced. While the life of a building can be up to 100 years, eventually everything needs to be replaced.
We experienced a mild downturn in the construction cycle between 2018 and 2020 when construction worked fell from a high of $32bn a quarter to $29bn in Q3 last year.
We have now seen growth in both Q4 and Q1 signalling the possibility of a renewed upswing. We have seen four cycles in the last 40 years defined broadly by the decade in which they occurred (the 1980s, 1990s, 2000s and 2010s). There is a good chance that a new 2020s cycle is underway which will see a steady expansion of construction activity until the end of the decade.
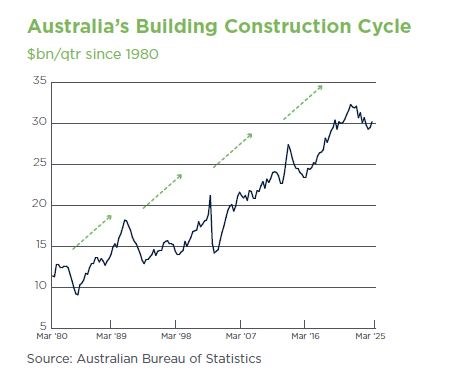
Each cycle results in a new higher level ‘peak’ for activity that is on average about 20% higher than the previous ‘peak’. These numbers are adjusted for inflation. This would imply that the current cycle will see a ‘peak’ in activity of around $38bn a quarter in the late 2020s.
Supporting this assessment are rising building approvals. In the month of April residential building approvals were valued at $8.4bn while approvals for non-residential building construction were $3.8bn. Total building approvals at $12bn translates into a $36bn quarterly run rate, which is consistent with the idea that the building construction cycle will swing higher over the years ahead.
The slowdown in population growth does not appear to have had any impact on building construction activity and building intentions. If anything, the pandemic has created demand for new types of buildings, particularly single houses and industrial structures.
There was concern that slower population growth would lead to a reduction in the demand for housing and thus new building. However, buildings are a longlife asset, and any view on the demand for housing and commercial premises needs to take account of that 50 year plus life span. A short-term disruption to the flow of new people into the economy will only have a small impact on those long-term calculations.
Infrastructure spending doesn’t tend to move in predictable ten year cycles. Infrastructure needs are determined by government policy and bigger trends such as the commodity cycle, technology and demographics. Australia has recently experienced a once in a century mining boom, an important part of which was a massive expansion of related infrastructure.
Australia’s infrastructure construction trends have been dominated by the mining sector over the past decade. The wind down in mining infrastructure spending new appears to be at an end. With government infrastructure plans winding up in the wake of the pandemic, there is also a very good chance that a new expansion of infrastructure spending in upon us. This will only exacerbate any emerging capacity constraints in the domestic construction industry, which, in the short-term, will be one of the biggest challenges for businesses operating in this space.
Australia’s exports through the pandemic: still lucky!
Who could have imagined a once in a century mining boom would be followed by a once in a century pandemic. That is exactly what has happened to Australia, and aren’t we lucky!
Our capacity to lift the production of iron ore has come just as a lift in global industrial production and infrastructure spending has driven the demand and price of steel higher. This has generated critical export earnings that have supported jobs, government revenues and confidence in the Australian economy, and most importantly, offset a decline in export earnings in other markets.
Strong iron ore exports mask a trend for more and more reliance on fewer export channels. There is a risk that if the global commodity cycle turns down, it could have a large negative impact on the Australian economy unless other exporters can recovery from the current downturn.
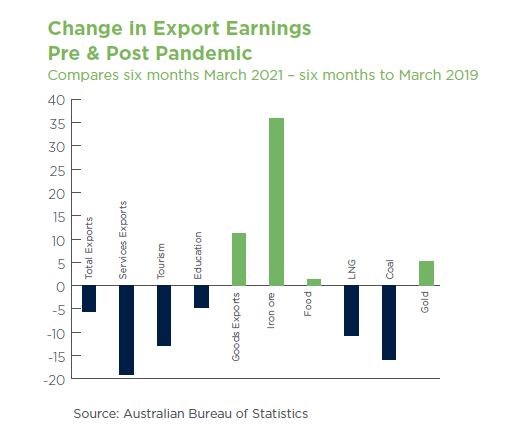
Tourism and educational services exports have halved due to the closed borders. Prior to the pandemic these two critical service sector exports earned around $5- 6bn a month for Australia. When the borders closed the flow of tourists dried up and many foreign students could not get into the country. Export earnings fell by more than half to around $2.5bn a month in early 2021.
Overall services exports amounted to about $100bn a year prior to the pandemic, making up about 20% of total export earnings. Over the year to March 2021 this has shrunk to about $60bn in earnings, and services are now under 15% of total export revenues for Australia.
Goods exports have made up for most of this decline in service export earnings. Total goods exports hit a record in the month of April at $36bn. But even within the goods space, the earnings are becoming more concentrated around iron ore.
Australia’s goods exports are highly concentrated with the top five export markets making up 80% of our goods export earnings. At number 1 is iron ore, accounting for just under 45% of goods exports ($16bn a month). Next comes food (mainly meat and grains) which, at just over $3bn a month in exports, is our second largest earner in early 2021.
Coal comes next, also at around $3bn a month, but is on the decline. Coal exports have declined by 40% through the pandemic, and are only 2% higher than where they were 10 years ago. This compares to a 70% increase for overall goods exports. LNG is on the rise having been a major element of the mining investment boom of the past decade. It is now 8.6% of goods exports, having doubled over the past 10 years.
LNG exports now regularly exceed $3bn a month. Gold exports round out the top five, worth about $2bn a month in earnings and account for 6.8% of goods exports.
These five export sectors earnt Australia about $80bn in the first quarter of 2021. This is just under 70% of total export earnings ($118bn). While there are literally thousands of small exporters operating in hundreds of markets, the great bulk of earnings come from a few sources. Hopefully, tourism and education exports will make a full recovery over the years ahead.
What appears to be missing is manufacturing. Even with a full recovery in tourism and education, Australia will be operating, as it was prior to the pandemic, at either end of the industrial spectrum: high value added services, and low value added primary products – with a yawning gap in between.
Disclaimer
This document has been prepared by Judo Bank Pty Ltd ABN 11 615 995 581 AFSL 501091 (“Judo Bank”). Any advice contained in this document has been prepared without taking into account your objectives, financial situation or needs. Before acting on any advice in this document, Judo Bank recommends that you consider whether the advice is appropriate for your circumstances.
So far as laws and regulatory requirements permit, Judo Bank, its related companies, associated entities and any officer, employee, agent, adviser or contractor thereof (the “Judo Bank Group”) does not warrant or represent that the information, recommendations, opinions or conclusions contained in this document (“Information”) is accurate, reliable, complete or current. The Information is indicative and prepared for information purposes only and does not purport to contain all matters relevant to any particular investment or financial instrument. The Information is not intended to be relied upon and in all cases anyone proposing to use the Information should independently verify and check its accuracy, completeness, reliability and suitability and obtain appropriate professional advice. The Information is not intended to create any legal or fiduciary relationship and nothing contained in this document will be considered an invitation to engage in business, a recommendation, guidance, invitation, inducement, proposal, advice or solicitation to provide investment, financial or banking services or an invitation to engage in business or invest, buy, sell or deal in any securities or other financial instruments.
The Information is subject to change without notice, but the Judo Bank Group shall not be under any duty to update or correct it. All statements as to future matters are not guaranteed to be accurate and any statements as to past performance do not represent future performance.
Subject to any terms implied by law and which cannot be excluded, the Judo Bank Group shall not be liable for any errors, omissions, defects or misrepresentations in the Information (including by reasons of negligence, negligent misstatement or otherwise) or for any loss or damage (whether direct or indirect) suffered by persons who use or rely on the Information. If any law prohibits the exclusion of such liability, the Judo Bank Group limits its liability to the re-supply of the Information, provided that such limitation is permitted by law and is fair and reasonable.
This document is intended only for clients of the Judo Bank Group, and brokers who refer customers to the Judo Bank Group, and may not be reproduced or distributed without the consent of Judo Bank.
The Information is governed by, and is to be construed in accordance with, the laws in force in the State of Victoria, Australia.